When it comes to health and safety in the city, factors big and small — from the number of public benches to noise levels to tree canopy — can strongly affect residents’ lives.
A new online tool just released by the nonprofit Transportation Alternatives (TA) in cooperation with the Massachusetts Institute of Technology (MIT) allows New Yorkers to see detailed data about how space is used in their neighborhood — and how some communities struggle constantly with problems that barely register in others.
The searchable web tool, Spatial Equity NYC, has loads of data points showing how the city’s neighborhoods rank in terms of design and use of public space.
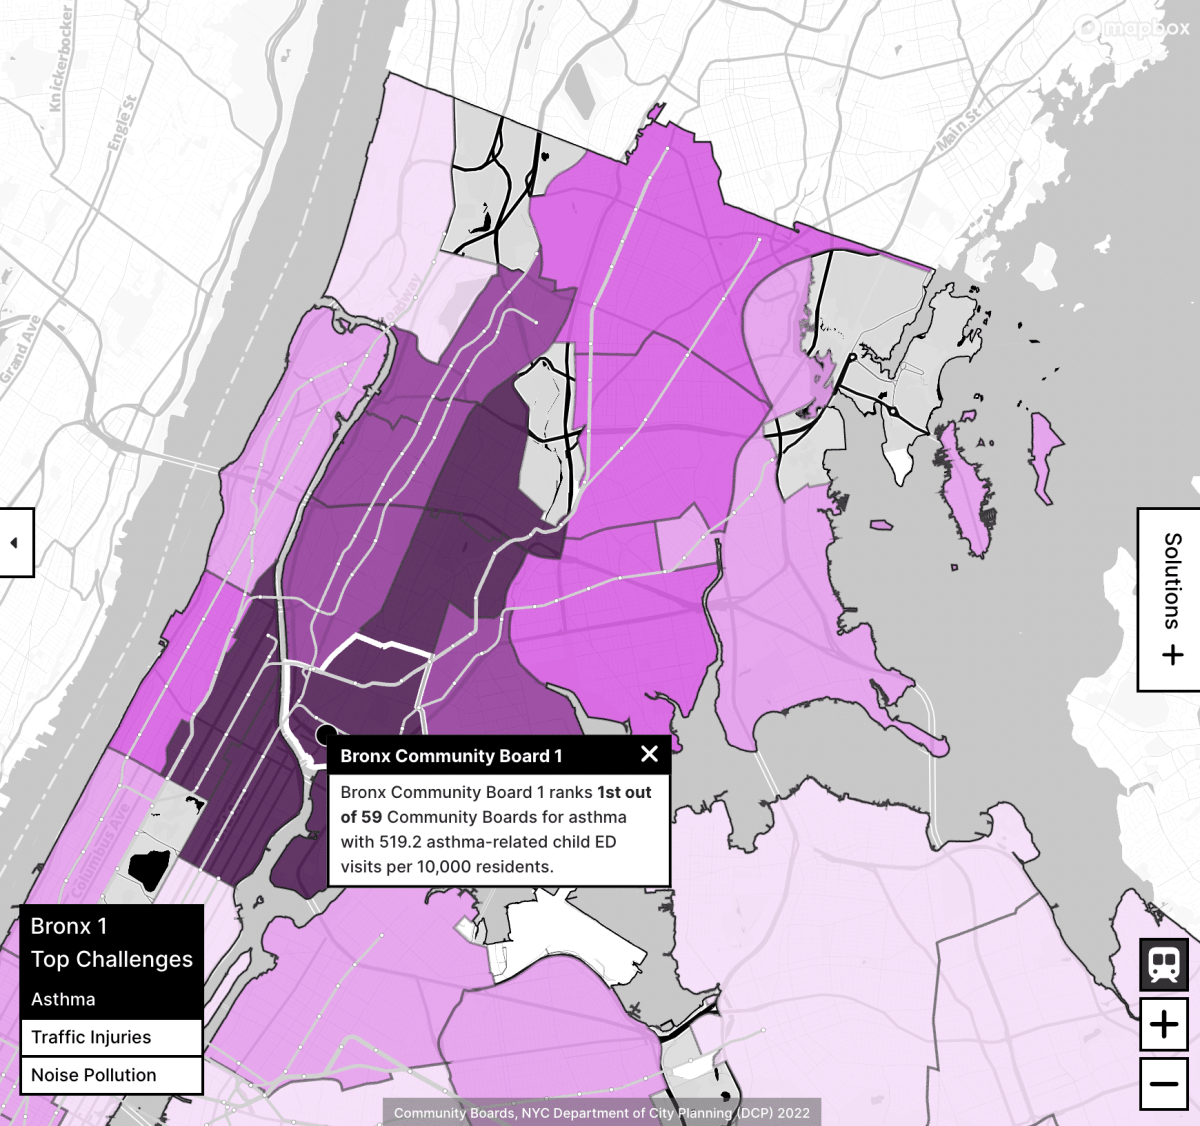
The site published some notable findings for the Bronx. For instance, Bronx Community Board 1, which includes Mott Haven, Melrose and Port Morris, ranked highest in the city — by far — for childhood asthma-related visits to the ER.
CB1 averaged 519.2 visits per 10,000 residents, whereas the city average was 173. CB1 far outpaced the next-highest, Manhattan CB11 (East Harlem), which averaged 471.3.
By comparison, childhood asthma visits to the ER were rare in Staten Island CB3, which had the lowest average — only 24.5.
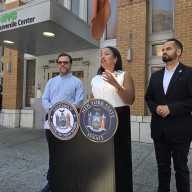
Disparities like these are what the tool is meant to highlight, said Jada Yeboah, the Bronx/Uptown organizer for Transportation Alternatives.
“This isn’t random. There’s a clear lack of investment in Black and brown communities,” Yeboah told the Bronx Times.
‘Everything is connected’
While findings like these may not be surprising, the ability to overlay different data points allows users to see how “everything is connected,” said Yeboah.
Some predictable patterns emerge. For instance, since CB1 ranks high for asthma, it may come as no surprise that it also ranks second in the city for serious traffic injuries.
TA recently identified East 138th Street and Bruckner Boulevard as the city’s most dangerous roadway, with the highest rate of deaths per mile.
Since 2022, CB1 had 15.3 serious injuries per 10,000 residents — more than twice the citywide average of 6.07.
The overall picture of traffic safety in the South Bronx was bleak. CB2 (Hunts Point, Longwood and Morrisania) ranked second citywide in traffic fatalities and third in serious traffic injuries.
Other findings were a mixed bag. For instance, while CB 12 had a low rate of traffic injuries (56th out of 59), it ranked high —ninth in the city — for average summer surface temperature, suggesting a lack of tree cover.
Bronx CB4 (Highbridge, Mt. Eden, West and East Concourse and Concourse Village) ranked worst in the city for noise pollution, averaging 57.2 decibels, with a citywide average of 53.4. The rate of traffic injuries in this neighborhood was also high, sixth in the city, correlating to the noise level.
The data also shows that some Bronx communities can easily take advantage of the city’s greenest borough — while other nearby communities are left out.
In CB8, which covers Riverdale and Kingsbridge Heights, 86.5 percent of residents live within walking distance of a park — higher than the citywide average of 83.4 percent. But CB10 (Throggs Neck and Pelham Bay) ranked second-to-last for park access at just 56.7 percent.
CB10 data also brought bad news for cyclists, as it ranked dead last in the city with zero percent of its streets designated as protected bike lanes.
No more ‘paper streets’
The Spatial Equity tool adds a fresh perspective by adding possible solutions alongside every challenge faced by each of the city’s neighborhoods.
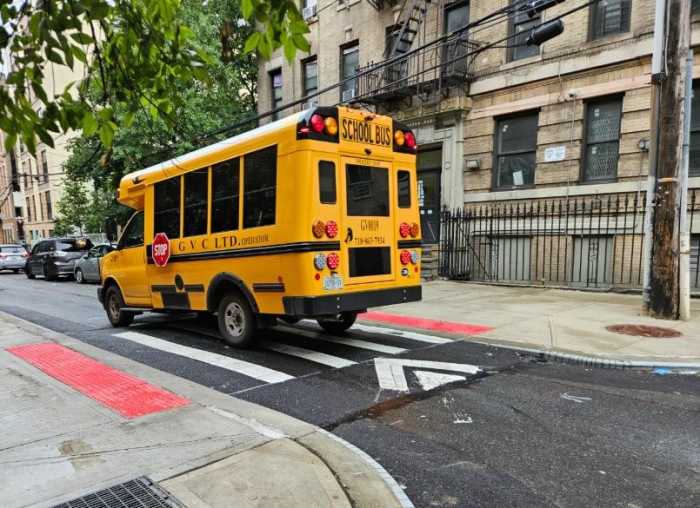
For instance, to mitigate asthma problems in CB1, the suggestion is to create “clean air school streets,” prohibiting cars in one-block areas where kids are dropped off and picked up from school.
The city has already proven that “pedestrianization” makes a difference, according to the site. Air pollution was cut in half in areas that temporarily prohibited cars in parts of Times Square and Park Avenue for the Summer Streets program.
Yeboah told the Bronx Times that her organization has also been working in the Bronx to identify “paper streets,” meaning “a street that is on the map as a street, but when you go in, it’s kind of dilapidated, there’s not anything happening there.”
Those types of underutilized spaces are prime for beautification and conversion. Yeboah said that TA’s role is to imagine “ways we can change these streets — we take them back, but what can they look like?”
As for the new Spatial Equity website, TA plans to present it to community boards and local organizations so that it makes its way to elected officials.
Yeboah said “it would be negligent if they didn’t” use this neighborhood-specific data to inform spending decisions. After all, the data is meant to show strategies that are working in certain communities that should be implemented in others.
In most situations where a disparity exists, said Yeboah, “It’s very unfair but it’s completely fixable.”