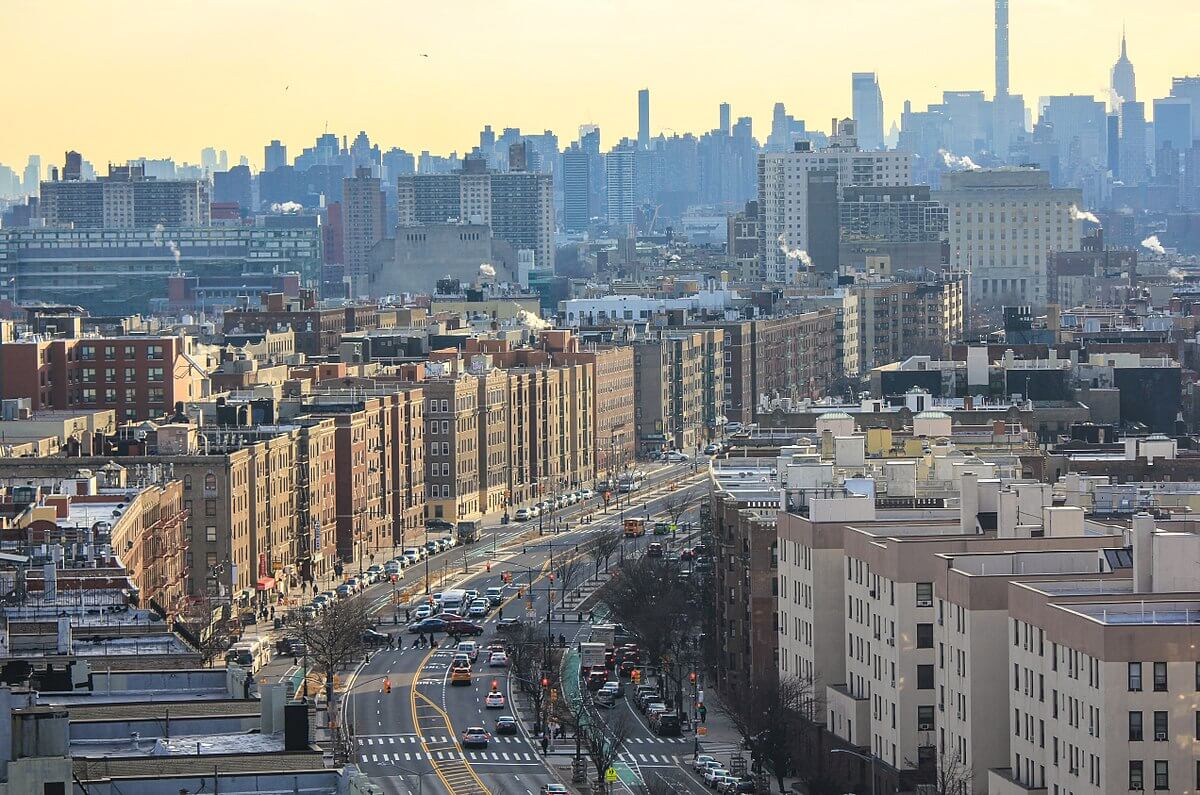
The Bronx was one of 10 counties in the nation that saw higher-than-expected growth over the past decade — reaching an all-time high of 1.47 million residents — per recently released 2020 U.S. census data.
Much of the Bronx’s 6.3% growth — an addition of 87,546 people to the borough — over the past decade can be attributed to the large population increases in Morrisania (22%) and Crotona Park East (15%).
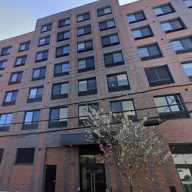
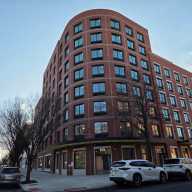
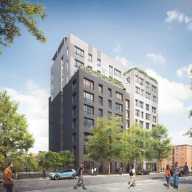
Morrisania has been a section earmarked for significant investment for affordable housing projects over the preceding years, including the Garden Towers Apartments, a $93 million affordable and supportive housing development that broke ground last week.
The northernmost borough’s population also saw major increases of 5,000 residents apiece in the Mott Haven-Port Morris and Williamsbridge-Olinville sections.
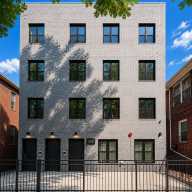
Over the past decade, Mott Haven has been a hot spot for increased residential and commercial development, alerting some residents to fears of gentrification toward the tail-end of the decade.
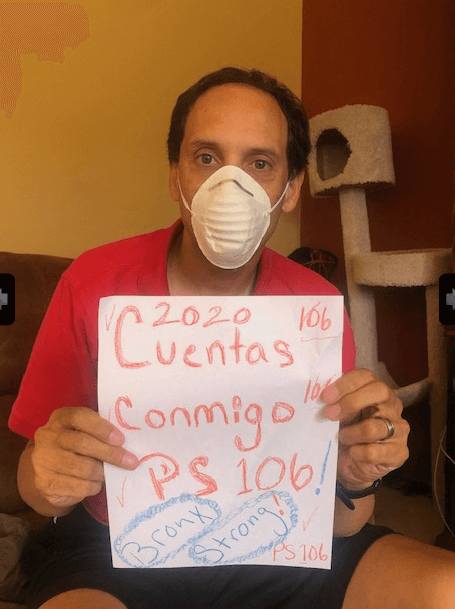
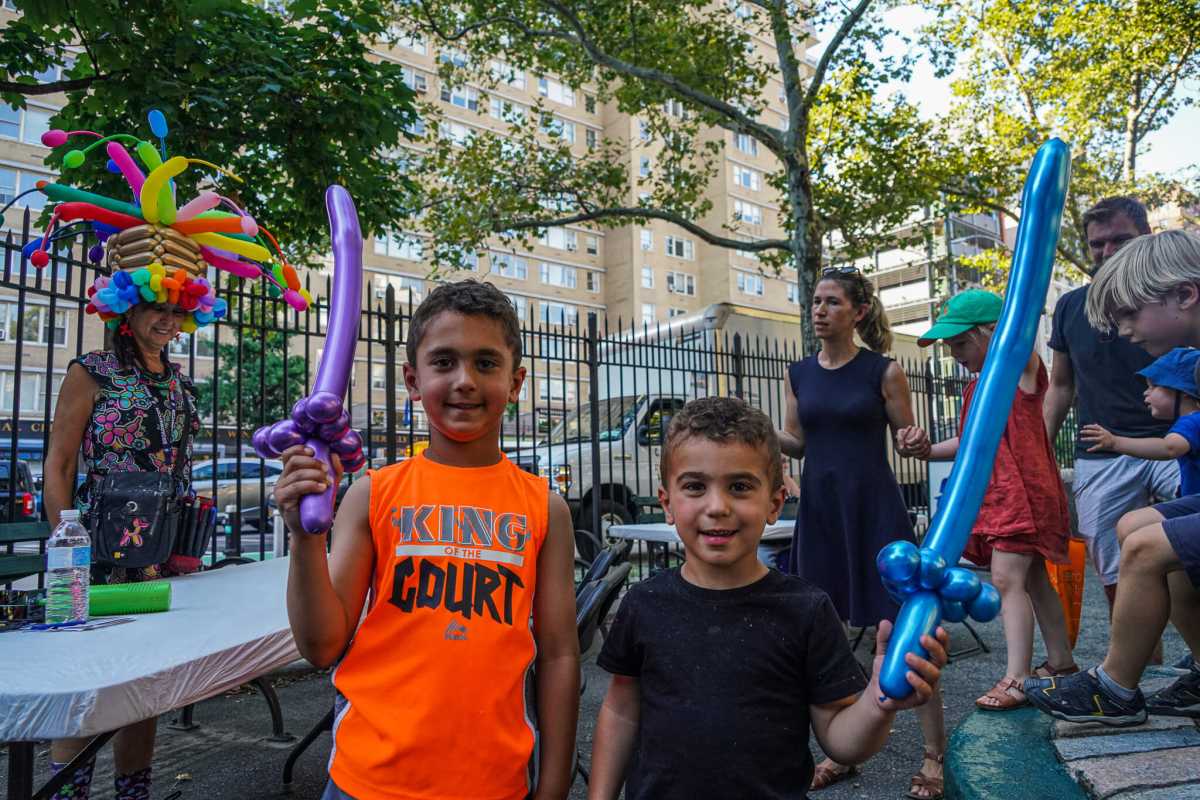
Where all my Bronxites at?
Population counts by section, according to 2020 census:
Soundview/Bruckner/Bronx River – 74,342
Concourse-Concourse Village: 69,387
Mott Haven- Port Morris – 57,718
Bedford Park – 55,521
Eastchester/Edenwald/Baychester – 51,736
Mount Eden-Claremont (West) – 49,651
Throgs Neck/Schuylerville – 48,116
Riverdale/Spuyten Duvyil – 47,927
Wakefield/Woodlawn – 47,657
University Heights (North)/Fordham – 46,538
Norwood – 43,466
Melrose – 42,651
Castle Hill/Unionport – 41,420
Longwood – 40,289
Morrisania – 37,607
Co-Op City – 37,369
Soundview/Clason Point – 37,297
Kingsbridge Heights-Van Cortlandt Village – 35,777
Belmont – 35,825
Allerton – 34,623
Parkchester – 33, 602
Pelham Parkway/Van Nest – 32,425
Highbridge – 32,456
Tremont – 32,150
Crotona Park East – 30,158
Pelham Bay/Country Club/City Island – 29,462
Morris Park – 25,077
Claremont Village/Claremont (East) – 24,553
Kingsbridge-Marble Hill – 22,807
West Farms – 20,147
Westchester Square – 17,376
Hunts Point – 15,131
When comes to housing an increasing number of Bronxites, approximately 95% of available housing stock in the Bronx is occupied, according to Census statistics released on Aug. 12. At the time of the census count, 24,580 vacant housing units
Of the five boroughs, the Bronx has the second-highest group of people living in clusters and the second-highest average household size — 2.72 per household — which health experts said left the borough susceptible and vulnerable to rapid spreads of COVID-19 variants.
Based on population, the Bronx would classify as the sixth-largest city in the nation, behind Philadelphia, Pennsylvania, but larger than cities like San Antonio, Texas.
Demographically, the Bronx remains a diverse pocket of New York City, accounting for the highest share of non-white Hispanics and Blacks in the five boroughs.
Reach Robbie Sequeira at rsequeira@schnepsmedia.com or (718) 260-4599. For more coverage, follow us on Twitter @bronxtimes and Facebook @bronxtimes.